Interfaz de usuario
Trend Chart Properties
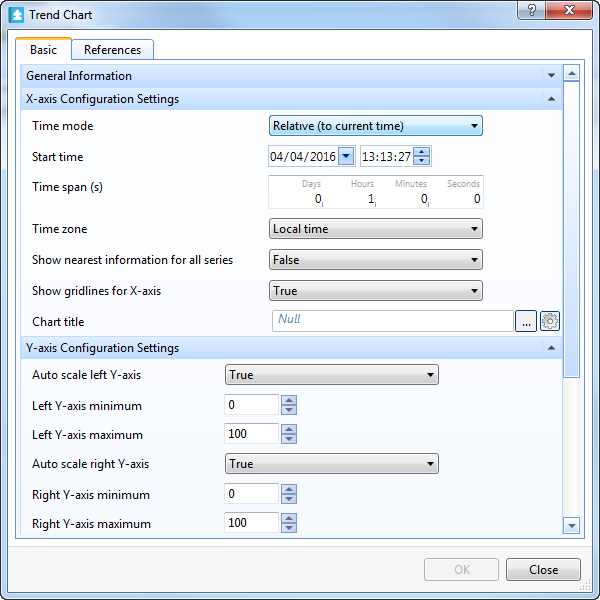
Use the Trend Chart Properties dialog box to configure the general properties of the trend chart.

|
Property |
Description |
|
Time mode |
Select the time mode of the x-axis. |
|
Start time |
Enter the absolute start time when Time mode is set to Absolute . This time is the leftmost point of the x-axis. |
|
Time span |
Type the relative time span of the x-axis. |
|
Time zone |
Select the time zone of the trend log list. The mode is the perspective in which the trend log is displayed. |
|
Show nearest information for all series |
Select True to show information on every series along a diagonal line. |
|
Show grid lines for X-axis |
Select True to show grid lines for the x-axis. |
|
Chart title |
Enter the property reference or relative property reference to the folder or other container whose name you want to include in the trend chart title. |
|
Auto scale left y-axis |
Select True to activate auto scale and have the left y-axis adapt itself to the displayed series. |
|
Left y-axis minimum |
Enter the minimum value of the left y-axis. |
|
Left y-axis maximum |
Enter the maximum value of the left y-axis. |
|
Auto scale right y-axis |
Select True to activate auto scale and have the right y-axis adapt itself to the displayed series. |
|
Right y-axis minimum |
Enter the minimum value of the right y-axis. |
|
Right y-axis maximum |
Enter the maximum value of the right y-axis. |
|
Show grid lines for left Y-axis |
Select True to show gridlines for the left y-axis originating from the y-axis scale. |
|
Show grid lines for right Y-axis |
Select True to show gridlines for the right y-axis originating from the y-axis scale. |
|

|
Add Click to add a series to the trend chart. Para obtener más información, consulte Create Object Wizard – Naming the Object Page . |
|

|
Edit Click to edit a selected series. Para obtener más información, consulte Trend Chart Series Properties . |
|

|
Remove Click to remove a selected series. |
 Gráficos de tendencias
 Trend Chart Y-Axis has Scale Problems
 General Information Properties – Basic Tab
 References Tab
 Trend Chart Properties